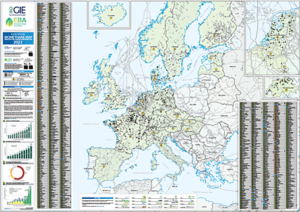
System Capacity Map
| Download | Published | Size | Type |
|---|---|---|---|
| System Capacity Map #2024 | 2024/01/11 | 10.32 MB |
Yesterday, #ENNOH founding operators unveiled milestones and objectives in a key stakeholder workshop.
🔍@PvanAartsen & @AbelDavEnriquez emphasised the importance of stakeholder engagement in successfully setting up ENNOH and accelerating the #hydrogen market's development.
📣Registration is officially open!
Grab your early bird for #GIEAnnualConference's 21st edition:
➡
Join us in inspiring #change & creating #sustainable solutions today:
📅17-18 October 2024
🇩🇪Munich, Germany
🤝Meet 300 EU energy leaders
Securing Europe's energy future: robust infrastructure, supply diversification, and efficient regulation are key. 👉 Read GIE Secretary General @AchovskiBoyana's insights on #energysecurity and #decarbonisation via @EnergyInReview:
🔓How to unlock #hydrogen infrastructure's full potential in Europe?
🎯We were live at #EnagásH2TechnicalDay. GIE Secretary General @AchovskiBoyana presented the regulatory challenges towards the availability of #mature H2 techs.
Watch @enagas' event👇
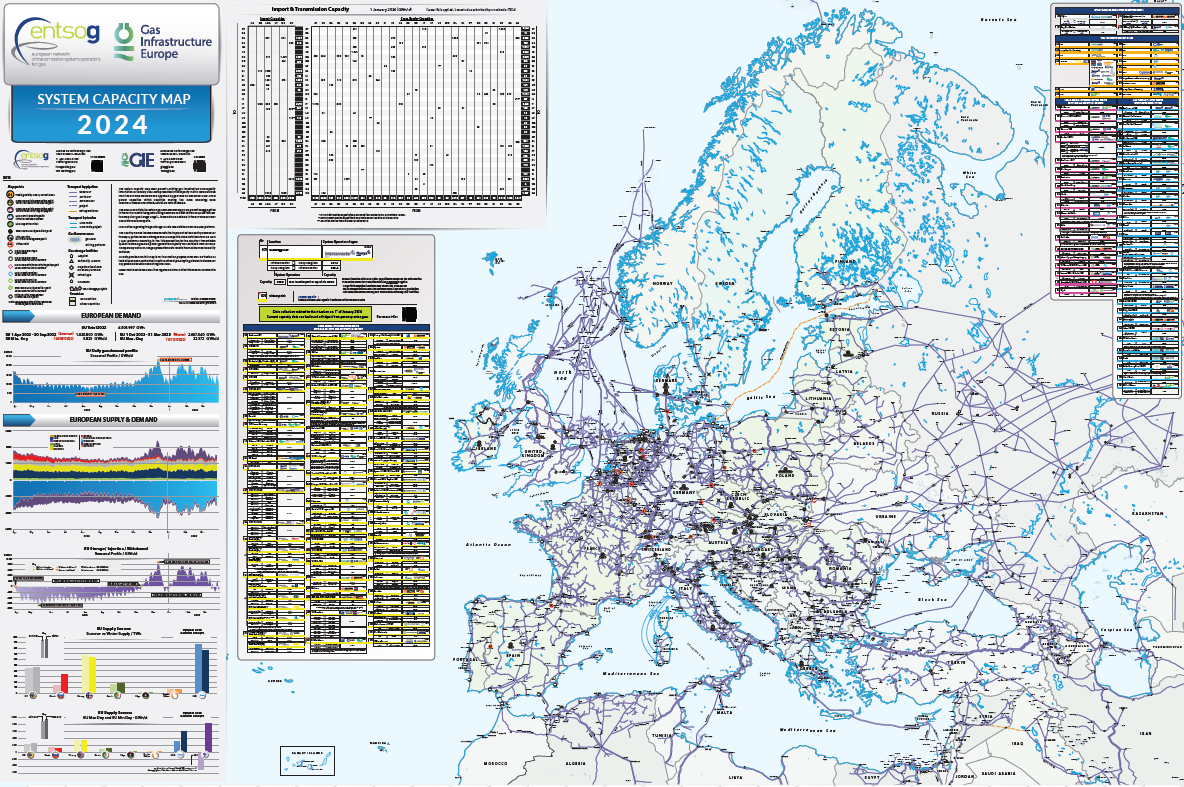
The System Capacity map illustrates the latest European gas infrastructure and capacities, providing useful gas market data for enhanced transparency. Historical data on gas demand and supply at European level from the latest Summer and Winter Review Reports are presented aggregated in the form of charts. The map also presents import and transmission capacity data as of date of publication. Information regarding the gas storage fill rate and LNG capacities shown were obtained from the GIE AGSI and ALSI platforms respectively.
This map is published jointly with ENTSOG.
The System Capacity map was first published in 2024 and combines the information from the former System Development and Transmission Capacity maps.
| Version | 2024 |
|---|---|
| Updates | Annual |
| Format | XXL |
| Dimensions | 1600 x 1200mm |
| Process | Quadri color offset print |
| Paper options | 250g glossy paper with glossy lamination on one side |
| Finishing options | Plano (rolled) |
| Packaging | Delivered in cardboard box |